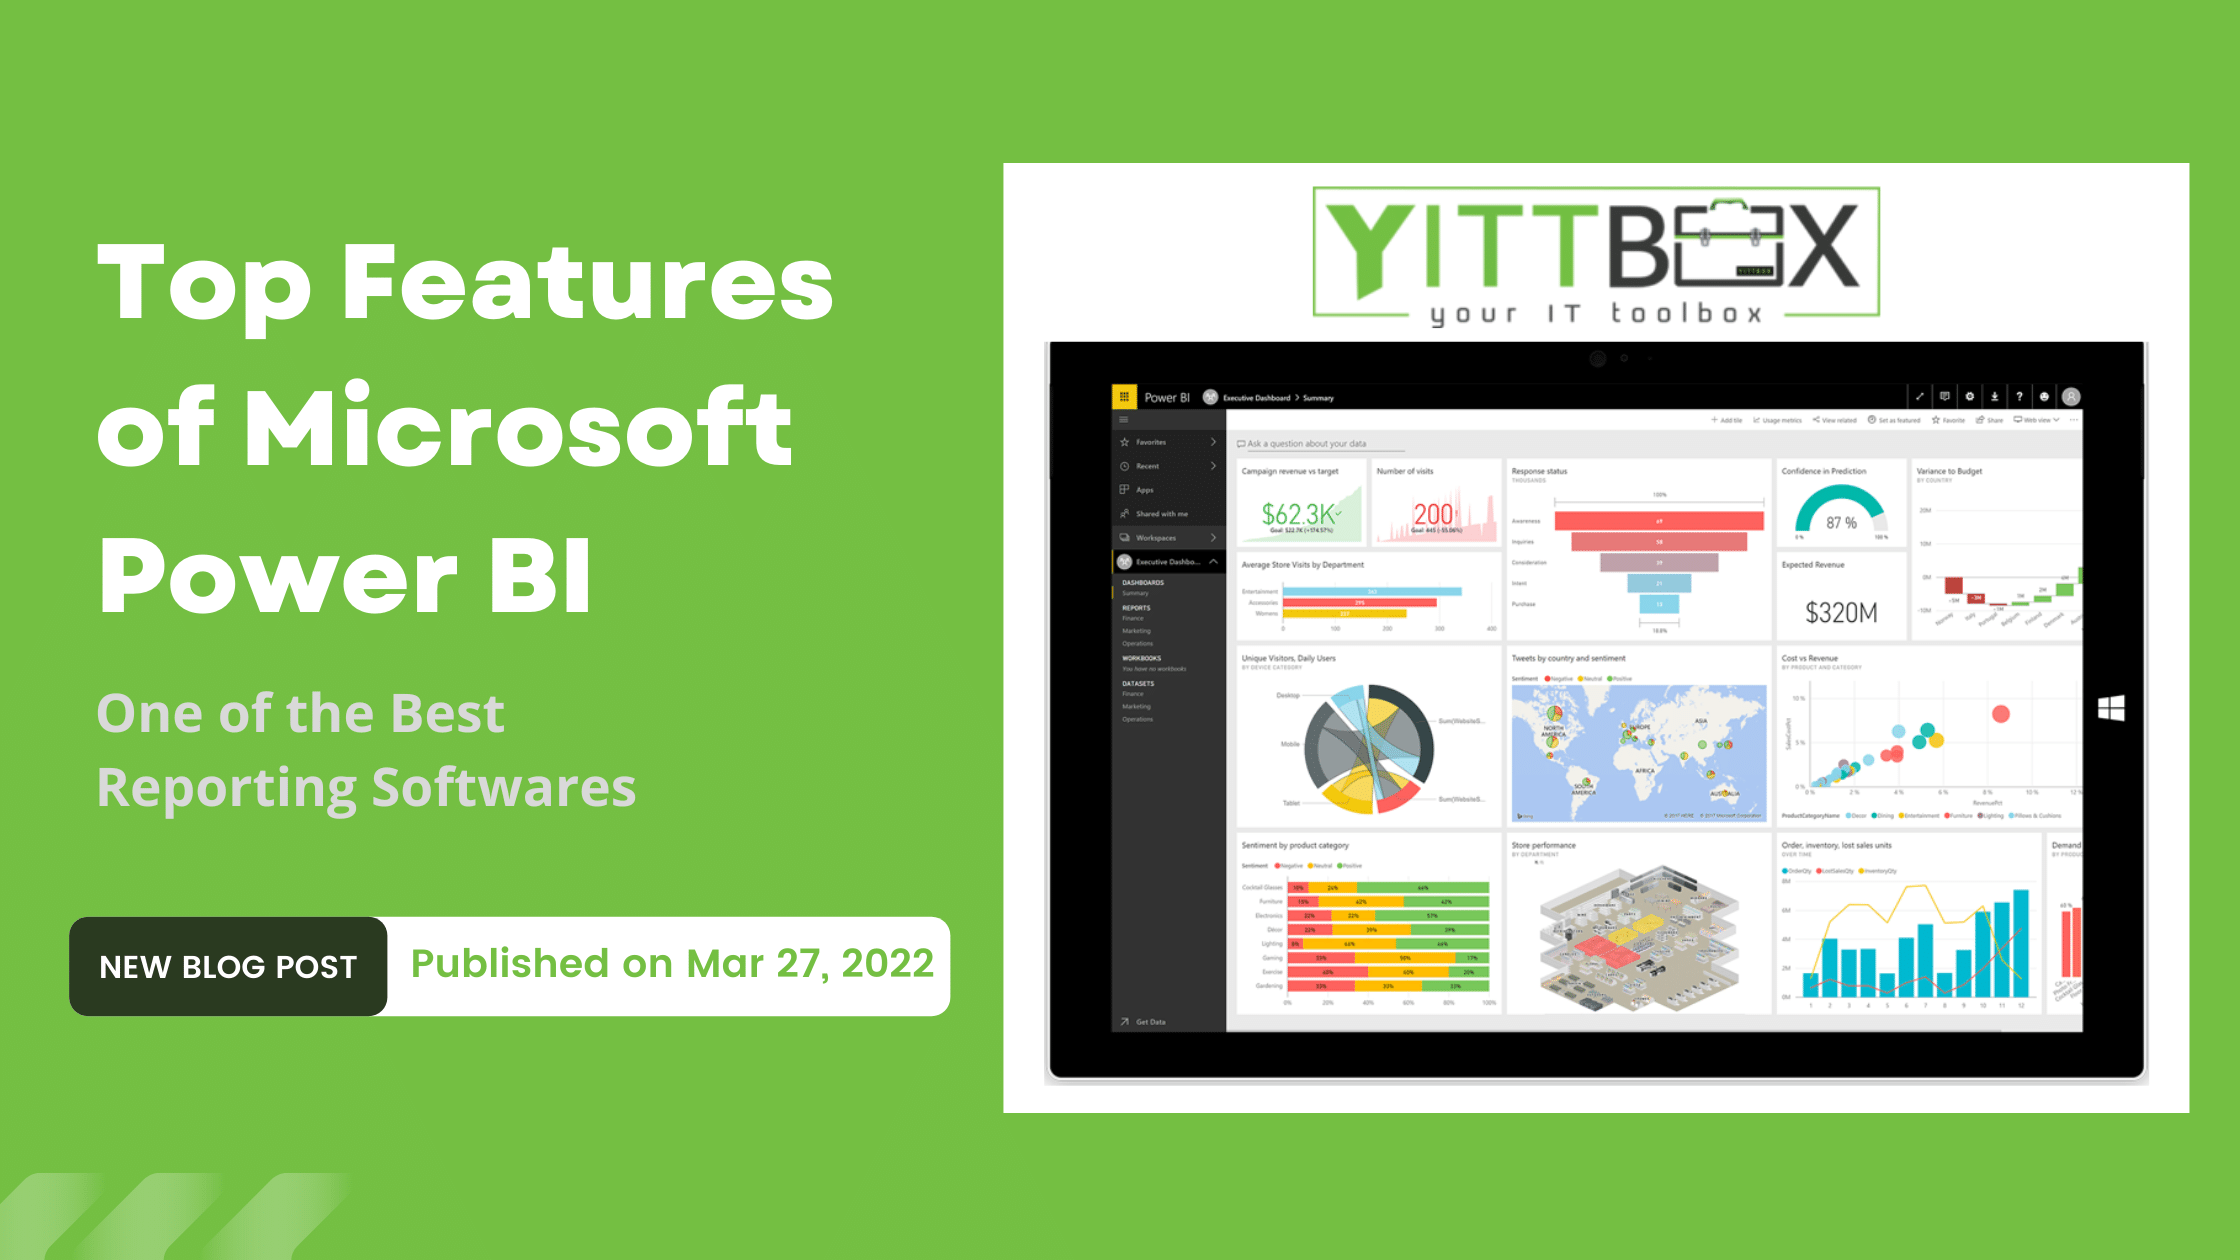
This blog will dive into the Top Features of Microsoft Power BI. Microsoft Power BI is among the most well-known and used tools for business intelligence. Companies worldwide depend on it for the most advanced analytics and data visualization. Microsoft Power BI features help you make better decisions and avoid losses.
Microsoft Power BI is a software suite that consists of business intelligence tools, such as software services, applications, and data connectors. It is an online system used to integrate data from various sources into one data set.
Data sets are utilized to display data, evaluate, and analyze by creating available dashboards, reports, and apps. Microsoft provides three different Power BI platforms, i.e., Power BI Desktop (a desktop application), Power BI Service (SaaS, i.e., Software as a Service), and Power BI Mobile (for iOS and Android devices).
You can use power BI both on-premise as well as on the cloud. It also allows data to be imported into local data sources or databases, cloud-based data sources, data from Excel files, and other hybrid sources. Therefore why Power BI leads over other BI tools, is an efficient and user-friendly instrument to analyze data. It lets users combine data from various sources, create interactive dashboards, assess data, create informative reports and share them among other users.
The following are some of the top features of Microsoft Power BI.
Visualizations (or visuals) are a way to display the insights from data. Power BI reports might contain one page with a visual or multiple pages with many visuals. You can pin power BI visuals directly from reports to dashboards. You can also create a variety of attractive and detailed visualizations. You can create reports and dashboards with as many or as few visualizations as you need to show your data. A library is available to create custom visualizations.
2. Create Customizable Dashboards
A collection of visualizations providing meaningful information or insights into data are called dashboards. Power BI dashboards usually have multiple visualizations. They are page form reports. They are printable and shareable.
3. Data Filtration Process in Microsoft Power BI
A dataset is a collection of data created when data comes from multiple sources. To create different types of visualizations, you can use these datasets. A dataset can contain data from one source (e.g., Excel workbook) or several sources.
You can filter data to find the most important and relevant information. Power BI has built-in data connectors, such as Excel, SQL database, Oracle, etc. You can connect to these data sources and import data from one or more of them to create datasets.
4. Visibility Features
Data is the heart of every business. Organizations today face the greatest challenge in managing information while manipulating data with other data sets to help them retrieve useful information.
A great way to achieve this is to collect different datasets and organize them visually for better understanding. It helps organizations better understand their data and give them a competitive edge over other businesses.
These are just a few of the features that Power BI offers. Let's now move on to what Power BI does to provide actionable insights. Power BI is a tool that makes data analysis quick, easy, agile, and user-generated. It simplifies data analysis, collaboration, sharing, and taking the process to the next level.
5. Data Transforming with Power Query
Struggling with how to join, pivot, or filter your data. Power Query is a powerful tool that allows you to import and transform data from various sources using Power BI. The interface is simple to use even with a low to no coding experience. Analysts can transform, join, and modify their data even without programming or SQL knowledge.
Connect to files, databases with one of the many prebuilt SaaS connectors. Or you can connect directly to the cloud and on-premises databases like SQL Servers Redshift, Redshift Snowflake, and BigQuery.
6. Security Features
Power BI uses an Active Directory to create access to the control panel. This panel allows the organization to use different Microsoft solutions. Power BI allows for the development of security measures that allows access to be granted in a controlled way.
7. Execution Process of Microsoft Power BI
Power BI implementation is very simple, as it requires minimal IT resources and technical skills. There are some instances where it is unnecessary to have any technical knowledge. Managers need to create an API Key and then plug it into the software. For enterprises using Microsoft Office 365 systems, Power BI integration is easy.
8. Microsoft Power BI Mobile App
Power BI app is a set of apps that you can download to your smartphone and tablet. They allow you quick access to your Power BI reports or dashboards. They also allow you to access your data, make insights, collaborate while on the move, and be notified whenever your data changes.
Power BI apps for mobile allow you to access your data. However, it is not possible to create or edit reports. The apps work the same as Power BI. Tabs makes it easy to navigate among different workspaces or reports quickly. You can also access power BI reports by clicking on different visuals or even using slicers to filter the data.
9. Well-Structured and Reachable Data
Power BI was designed to integrate a variety of Microsoft Tech such as SharePoint and SQL databases. It can even take data from non-Microsoft sources. Power BI can connect and integrate streaming data, cloud data, Excel spreadsheets, on-premise data sources, big data, streaming, and excel data. It doesn't matter where the data is located. Power BI can connect and analyze any data source. Power BI is well-known for connecting hundreds of data sources seamlessly.
Top Features of Microsoft Power BI: The Conclusion
Microsoft Power BI is an excellent business intelligence tool that is robust and powerful, which will continue to be a staple in the data visualization world for a long time. It allows hundreds of data sources to be connected quickly and infuses life into the data through detailed reports.
If you are unsure about its ability to handle/manage the future of a data-driven society, you can do some research and compare other available tools. But it is a certainty that Power Bi is going to carry on as a relevant tool for many years.


