IT Services & Technology Solution Services

IT Services  YITTBOX
Create an account and receive a discount code for any future services!
Get Discount Code Now

Reporting

At YittBox, we specialize in the Business Intelligence (BI) layer. We are experts in a number of reporting tools that will transform your raw data into meaningful, useful information. By doing this, it will give your business strategic and operational insight into making more informed business decisions. We can choose from several reporting tools to present your data sets through reports, summaries, graphs, dashboards, charts, and maps to paint a picture of the state of your business. We are here to help you gain perspective on the past, present, and future of your company.

Using these resources, we can help give you a realistic visualization of what your data represents. Making use of these tools can change the trajectory of your business plan, because they often offer insight into the gaps within the company that you wouldn’t gather otherwise. Reporting tools have given us the opportunity to actually interact with and manipulate data in such a way that even non-technical users can benefit from them. They enable decision-makers to make more informed and objective conclusions, and thus make changes in the business where needed.

HOW WE CAN HELP

YittBox is your one-stop shop for reporting and BI solutions. Here are the tools we specialize in:

Tableau Visual Analysis

TABLEAU

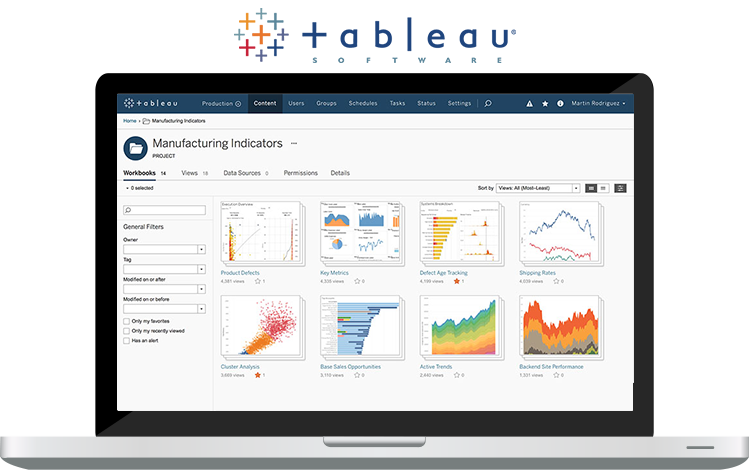
With Tableau, we believe the visual drives your analysis. When you get observable feedback as you analyze, the power of exploration is in your hands. When you build an analysis and learn from it simultaneously, opportunities for investigation present themselves. Tableau’s visual analytics makes asking and answering questions of your data intuitive, even as those questions naturally grow in complexity—so you can continue to ask, “Why?”

Immediate understanding

Tableau fuels unlimited data exploration by taking advantage of your natural ability to spot visual patterns quickly. This is all thanks to VizQL, Tableau's patented technology that translates drag-and-drop actions into data queries. In other words, Tableau builds analytics that work the way you think.

Analytics should be powerful

We believe that to help everyone see and understand data, we need to provide rich capabilities for users of all levels of technical ability. From simple, go-to metrics to advanced analytic techniques, Tableau provides a flexible front-end for data exploration with the necessary analytical depth for the data scientist. By leveraging sophisticated calculations, R and Python integration, rapid cohort analysis, and predictive capabilities, data scientists can conduct complex, quantitative analyses in Tableau, and share visual results to facilitate better understanding and collaboration with data.

Read More
Google Data Studio

Google Data Studio

Data Studio reports tell stories with data. These stories can persuade, provide insights, validate decisions, or argue for a change of course. Good reports help you find actionable information quickly and easily.

How Data Studio reports can help:-

  1. Unite your data in one place: Easily connect your data from spreadsheets, Analytics, Google Ads, Google BigQuery, and more.
  2. Explore the data: Transform your raw data into the metrics and dimensions needed to create easy-to-understand reports and dashboards — no code or queries required.
  3. Tell impactful stories: Create and share engaging reports and data visualizations that tell the story for you.
  4. Empower your teams: Arm people with the knowledge of your key metrics by sharing automated data dashboards that update regularly, so they can focus more on what matters.
  5. Dive into the details: See how you can bring your data to life with features like pre-built data connectors, calculated metrics, engaging data visualization, and our Explorer — a dedicated space to explore your data in greater detail.
Read More
PowerBI

POWERBI

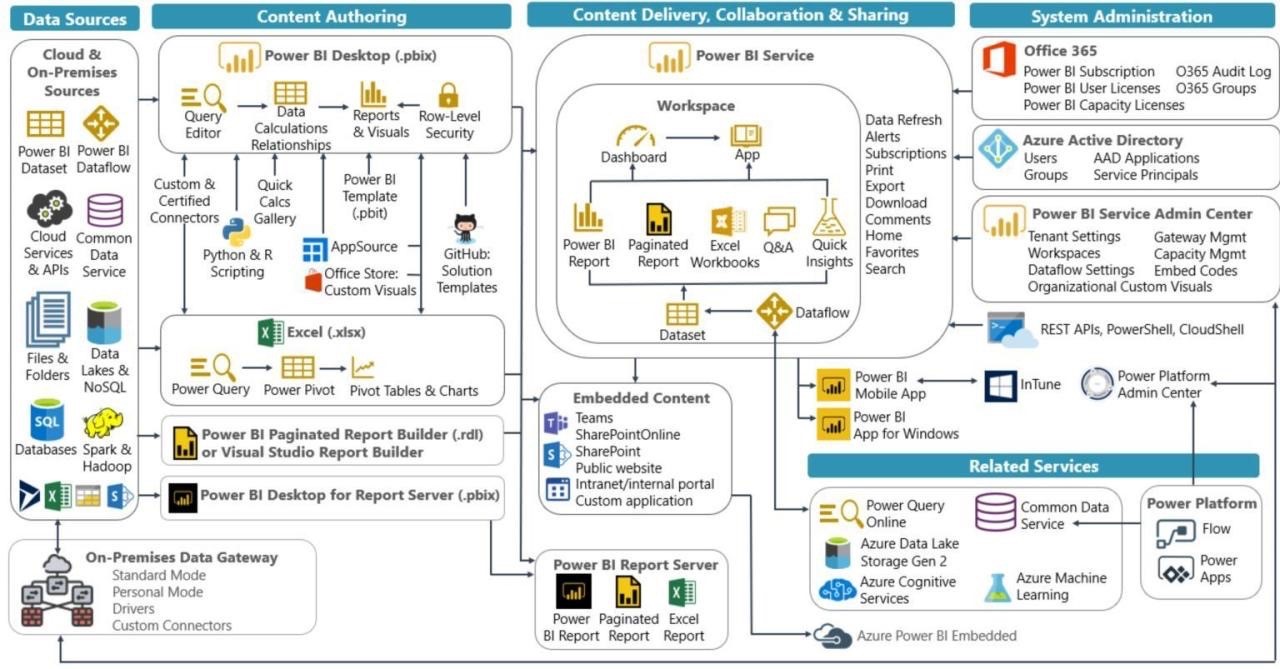
Microsoft’s Power BI is a business analytics and visualization solution built on the Power Pivot and Power Query engines. Users can use “Get Data” (Power Query) and “Data Model” (Power Pivot) to shape and analyze their data. They can then create interactive dashboards and reports, visualizing their data with Power BI’s every increasing number variety of visualizations. In fact, developers can also build custom visualizations to suit the individual needs of their companies. The uber data geeks out there can even use R scripts for custom visuals.

Read More
Congos

Cognos

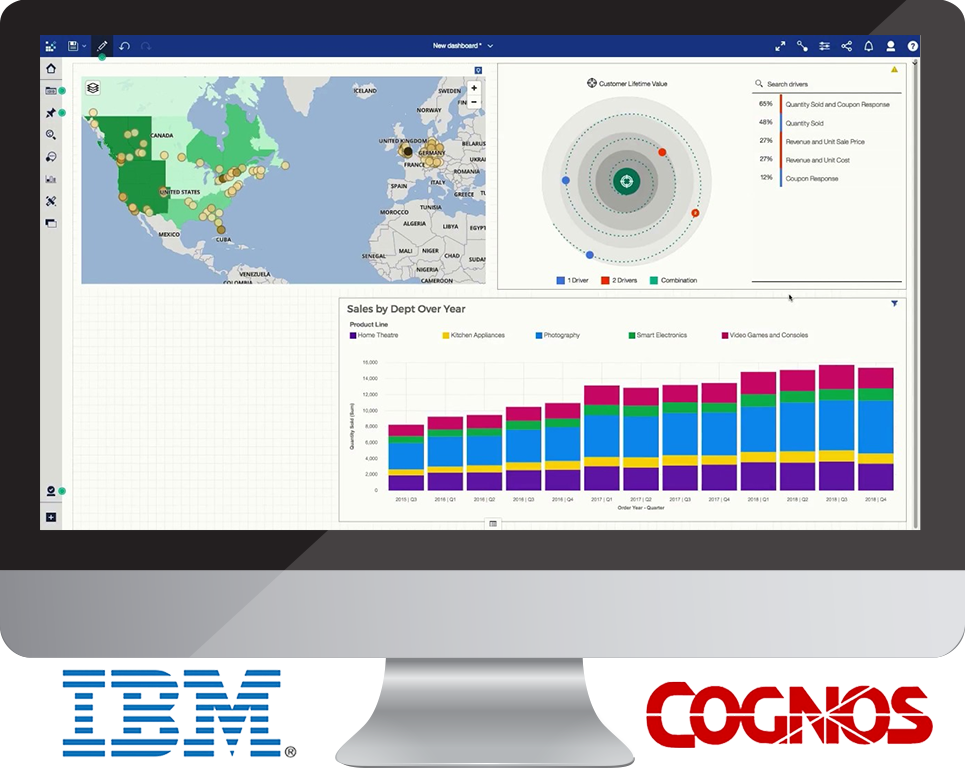
IBM Cognos Business intelligence is a web-based reporting and analytic tool. It is used to perform data aggregation and create user-friendly detailed reports. IBM Cognos provides a wide range of features and can be considered as an enterprise software to provide a flexible reporting environment and can be used for large and medium enterprise. Cognos also provides you an option to export the report in XML or PDF format or you can view the reports in XML format.

Audience

IBM Cognos provides a wide range of features and can be considered as an enterprise software to provide flexible reporting environment and can be used for large and medium enterprises. It meets the needs of Power Users, Analysts, Business Managers, and Company Executives.

Power users and analysts want to create ad-hoc reports and can create multiple views of the same data. Business Executives want to see summarized data in dashboard styles, crosstabs and visualizations. Cognos allows both the options for all sets of users.

Prerequisites

IBM Cognos Business Intelligence is an advanced topic. Even though the content has been prepared keeping in mind the requirements of a beginner, the reader should be familiar with the fundamentals of running and viewing reports or manage schedules, portal layouts, and other users' permissions before starting with this tutorial.

Read More
MS Excel

MS Excel

The use of Excel is widespread in the industry. It is a very powerful data analysis tool, and almost all big and small businesses use Excel in their day-to-day functioning. The powerful features Excel has to offer to analyze data

  1. Sort: You can sort your Excel data on one column or multiple columns. You can sort in ascending or descending order.
  2. Filter: Filter your Excel data if you only want to display records that meet certain criteria.
  3. Conditional Formatting: Conditional formatting in Excel enables you to highlight cells with a certain color, depending on the cell's value.
  4. Charts: A simple Excel chart can say more than a sheet full of numbers. As you'll see, creating charts is very easy.
  5. Pivot Tables: Pivot tables are one of Excel's most powerful features. A pivot table allows you to extract the significance from a large, detailed data set.
  6. Tables: Tables allow you to analyze your data in Excel quickly and easily.
  7. What-If Analysis: What-If Analysis in Excel allows you to try out different values (scenarios) for formulas.
  8. Solver: Excel includes a tool called solver that uses techniques from the operations research to find optimal solutions for all kind of decision problems.
  9. Analysis ToolPak: The Analysis ToolPak is an Excel add-in program that provides data analysis tools for financial, statistical and engineering data analysis.
Read More
MS ACCESS

MS ACCESS

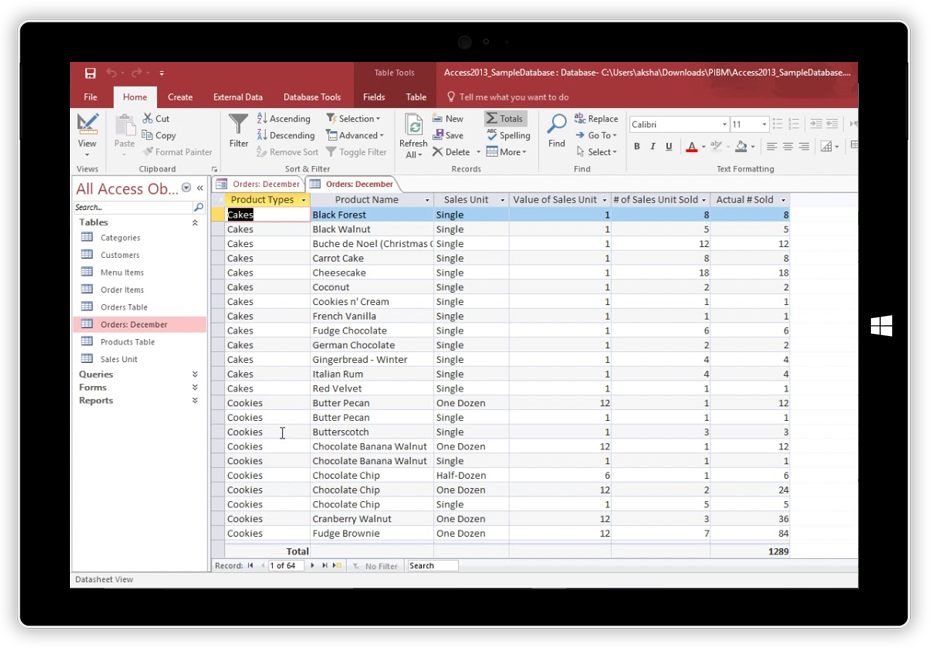
Very simply, Microsoft Access is an information management tool that helps you store information for reference, reporting, and analysis. Microsoft Access helps you analyze large amounts of information, and manage related data more efficiently than Microsoft Excel or other spreadsheet applications.

WHY SHOULD I USE IT?

All of the things people use as arguments against using MS Access turn out to be reasons for others to use it.

It’s super easy to use – hell yes it is. Setting up tables, queries, forms, and reports is a veritable walk in the park. You can import data from spreadsheets, text files, or other more suitable data sources like SQL Server and not be afraid of Janey from Accounts overwriting chunks of the production tables with an ill-advised UPDATE statement in Management Studio.

It’s not big enough, and my database just kept growing – over time you will eventually max out it’s size limits (somewhere around 2GB from personal observation), but for small scale datasets and quick analysis jobs this will give you more than enough space for very little server space overhead, and all you need is MS Access installed on your machine. This should come as standard with most MS Office installs so no fighting with the IT Department to install unwelcome 3rd party software.

It’s not secure enough – well don’t keep business-critical or top-secret secure data on it in a publicly accessible place then. You don’t need a full user access infrastructure to get started, load it up, fire in your data, run your queries or VBA and it’s all there in front of you.

Read More
SSRS

SQL Server Reporting Services (SSRS)

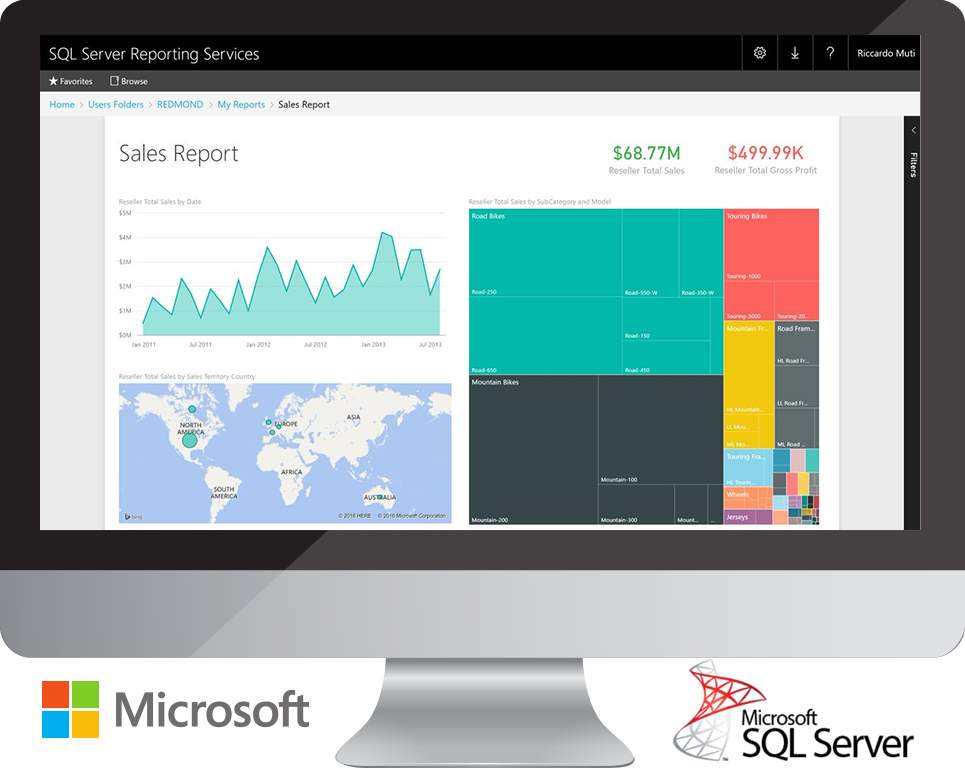
SQL Server Reporting Services (SSRS) provides a set of on-premises tools and services that create, deploy, and manage mobile and paginated reports.

Create, deploy, and manage mobile and paginated reports

The SSRS solution flexibly delivers the right information to the right users. Users can consume the reports via a web browser, on their mobile device, or via email.

SQL Server Reporting Services offers an updated suite of products:

  1. "Traditional" paginated reports brought up to date, so you can create modern-looking reports, with updated tools and new features for creating them.
  2. New mobile reports with a responsive layout that adapts to different devices and the different ways you hold them.
  3. A modern web portal you can view in any modern browser. In the new portal, you can organize and display mobile and paginated Reporting Services reports and KPIs. You can also store Excel workbooks on the portal.
Read More

Service Related Recent Works

Let’s Work together

Start your Project

Loading