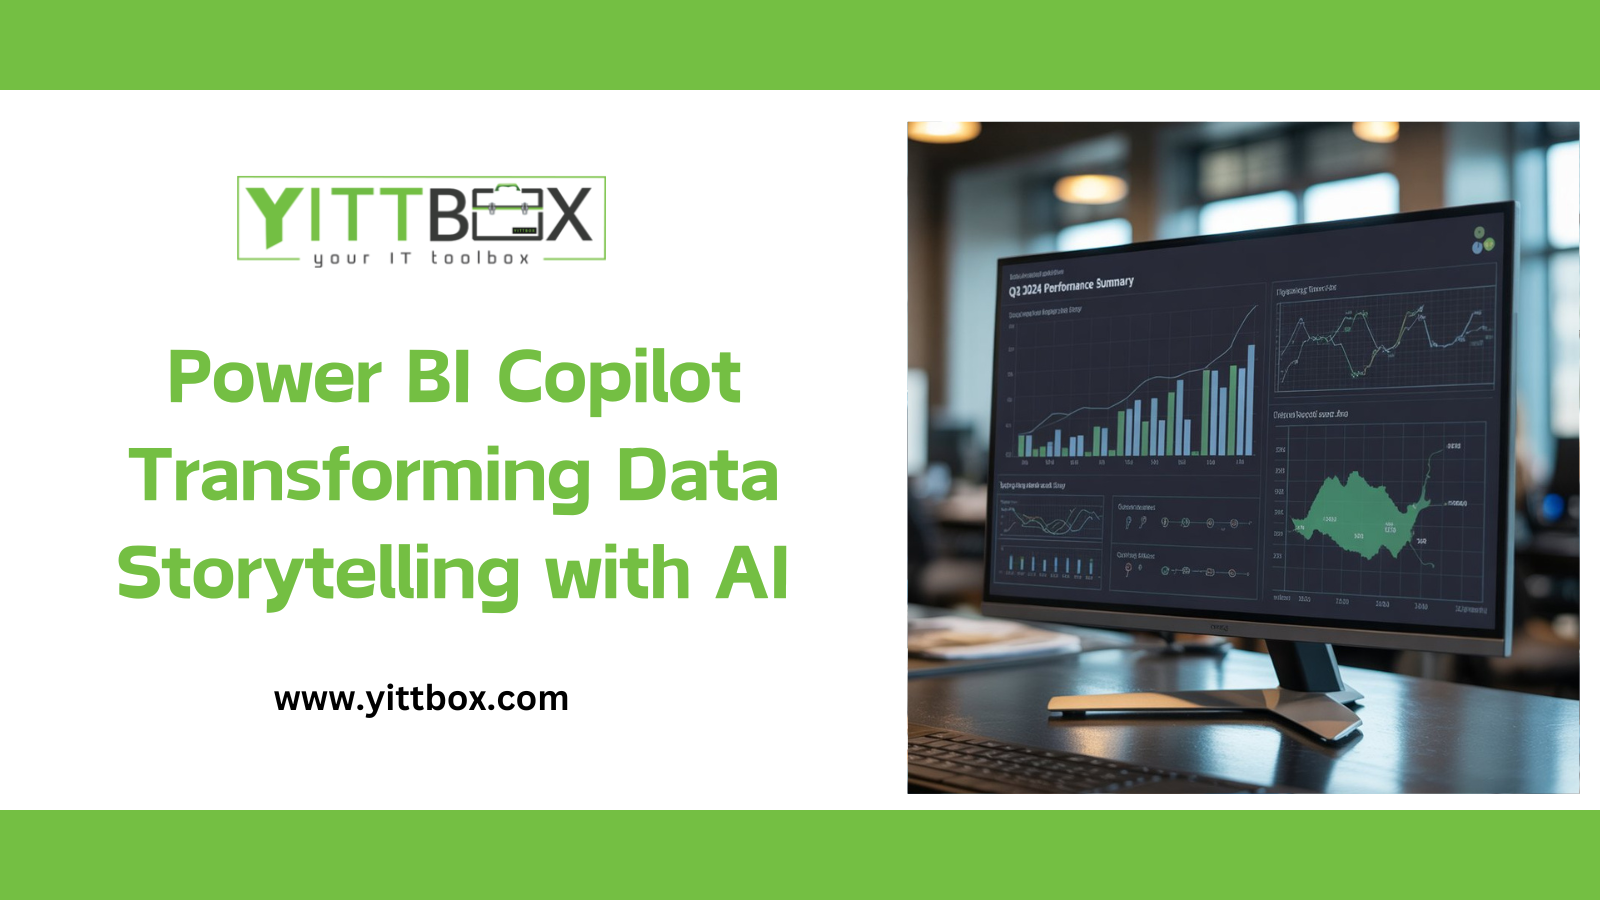
Power BI Copilot Transforming Data Storytelling with AI
In today’s digital-first world, data isn’t just an advantage, it’s the foundation of every business decision. Yet most organizations struggle not with collecting data, but with translating it into meaningful insight. Dashboards and spreadsheets can display metrics, but they rarely explain the why behind the numbers.
Microsoft’s Power BI Copilot changes this dynamic. By combining generative AI with Power BI’s robust analytics platform, Copilot turns raw data into contextual, human-readable narratives. It empowers leaders to understand trends, anticipate opportunities, and make confident, data-driven decisions faster than ever before.
Understanding Power BI Copilot
Power BI Copilot is an intelligent, AI-driven assistant integrated directly into Power BI and Microsoft Fabric. It allows users to interact with data naturally, by asking questions in plain language rather than writing complex formulas or DAX queries.
Ask, for example, “What drove revenue growth this quarter?” or “Which regions underperformed last month?” and Copilot instantly generates clear, concise, data-backed explanations. Beyond insights, it can also create full report layouts, summarize visualizations, and offer guided explanations for key metrics.
What makes Copilot transformative is accessibility. It bridges the gap between data professionals and decision-makers by translating complex analytics into insights anyone can understand.
The Evolution of Data Storytelling
For years, dashboards have served as the backbone of business intelligence, offering a visual snapshot of performance. But visuals alone often fall short of context, they show what happened, not why it happened.
Data storytelling changes that by blending visuals with narrative and context, making data actionable. Power BI Copilot takes this a step further with natural language generation (NLG), automatically producing narrative summaries that evolve with your data.
Instead of static charts, imagine your dashboard explaining, “Sales increased by 7% in Q3, driven by the Northeast region and a 15% rise in repeat customer purchases.” These narratives update in real time as filters change or new data flows in, allowing every stakeholder to understand the story behind the metrics.
How Power BI Copilot Works
Copilot enhances Power BI in several intelligent ways. Through Narrative Visuals, it automatically summarizes report data, highlighting top performers, anomalies, or trends based on your prompt. You can simply instruct it to “summarize key insights for Q2” and watch it generate an accurate, evolving narrative aligned with your filters and visuals.
It also enables conversational data exploration. Instead of manually navigating charts, users can chat with their data directly. Ask “Why did profit margins dip last month?” and Copilot will instantly analyze the underlying model and respond with a contextual explanation.
Additionally, AI-assisted report creation streamlines design. Copilot can recommend visuals, generate DAX measures, and suggest professional layouts, cutting hours of manual report-building time. It ensures every report not only looks consistent but communicates effectively.
Unlocking Business Value with Copilot
Power BI Copilot introduces measurable business advantages. It democratizes analytics, enabling non-technical users, from executives to field managers, to interact with data confidently. Complex dashboards become accessible, fostering stronger data literacy across the organization.
For analysts, Copilot boosts productivity by automating repetitive commentary and summaries. Time once spent explaining performance shifts can now be focused on deeper investigation and strategic decision-making.
Perhaps most importantly, Copilot delivers real-time, contextual insights. As data updates, so do the narratives. Teams can align around the same, up-to-date information, eliminating ambiguity and enabling faster, more unified decision-making.
Seamless Integration Within the Microsoft Ecosystem
Power BI Copilot is not an isolated feature, it’s part of Microsoft’s broader Fabric ecosystem, built to unify analytics across Power BI, Excel, Teams, and OneLake. This interconnected environment creates a consistent data experience across tools: analysts visualize insights in Power BI, executives review dashboards in Teams, and finance teams analyze live data in Excel.
Copilot strengthens this workflow by providing AI-generated commentary within each application. The result is a seamless, end-to-end analytics experience where insights are aligned, accessible, and actionable at every level.
Considerations and Current Limitations
As with any emerging technology, Power BI Copilot continues to evolve. Some current limitations include its availability, which is restricted to Power BI Premium and Microsoft Fabric users, and the fact that AI-generated narratives cannot yet be edited manually. Instead, refinements must be made through prompt adjustments.
Additionally, Copilot interprets only visuals present on the current report page, and certain features remain in preview. However, these are natural growing stages for a feature built with security, scalability, and governance in mind. As Microsoft continues development through 2025, the tool’s flexibility and precision will expand significantly.
Best Practices for Maximizing Value
To get the most out of Power BI Copilot, organizations should focus on clarity and consistency. Use precise, well-structured prompts, clear instructions lead to more accurate insights. Ensure all visuals and fields are properly labeled so Copilot can interpret them correctly. Combine data visuals with narrative explanations to reinforce understanding, and treat Copilot as a collaborative partner, refine prompts, iterate frequently, and evolve with the tool.
Equally important is promoting data literacy across teams. AI-generated insights are powerful, but they are most effective when users understand how to interpret and act on them responsibly.
The Future of AI-Powered Analytics
Power BI Copilot represents a pivotal moment in analytics, one where AI doesn’t replace human decision-making but amplifies it. As Microsoft deepens integration with Azure OpenAI and expands capabilities within Microsoft Fabric, the future of Power BI will include predictive analytics, voice-driven insights, and autonomous reporting.
Soon, dashboards won’t just summarize what happened; they’ll predict what’s next, identifying trends, risks, and opportunities before they surface. This marks a fundamental shift from descriptive to proactive intelligence, setting a new standard for how businesses use data to innovate and grow.
Conclusion
Power BI Copilot is redefining how organizations interact with data. By blending the analytical strength of Power BI with the conversational intelligence of AI, it transforms static reports into living, evolving data stories.
It removes barriers between data and understanding, making analytics faster, clearer, and more accessible across all levels of the enterprise. In an age where speed and clarity define competitive advantage, Power BI Copilot is not just an upgrade, it’s the future of intelligent business storytelling.


