.png&w=1920&q=75)
How to Connect and Visualize Your Data Sources in Google Data Studio
Google Data Studio is a powerful tool that allows you to visualize and understand your data in a whole new way. In this blog post, we will walk you through the process of connecting and visualizing your data sources in Google Data Studio.
Step 1: Sign in to Google Data Studio
To get started, sign in to your Google account and navigate to Google Data Studio.
Step 2: Create a New Report
Once you’re in Google Data Studio, create a new report. This will be the canvas where you’ll design your dashboard.
Step 3: Choose a Data Source
The next step is to choose a data source. Google Data Studio supports a wide range of data sources, from Google Sheets to SQL databases. You can even use Google Data Studio’s Community Connectors to incorporate, integrate, and visualize data from any third-party source.
Step 4: Connect to the Data Source
After choosing a data source, you’ll need to connect it to Google Data Studio. This process will vary depending on the data source, but generally involves entering your credentials and granting Google Data Studio permission to access your data.
Step 5: Configure the Data Source
Once your data source is connected, you’ll need to configure it. This involves selecting the specific data you want to include in your report, and how you want it to be displayed.
Step 6: Build Your Report
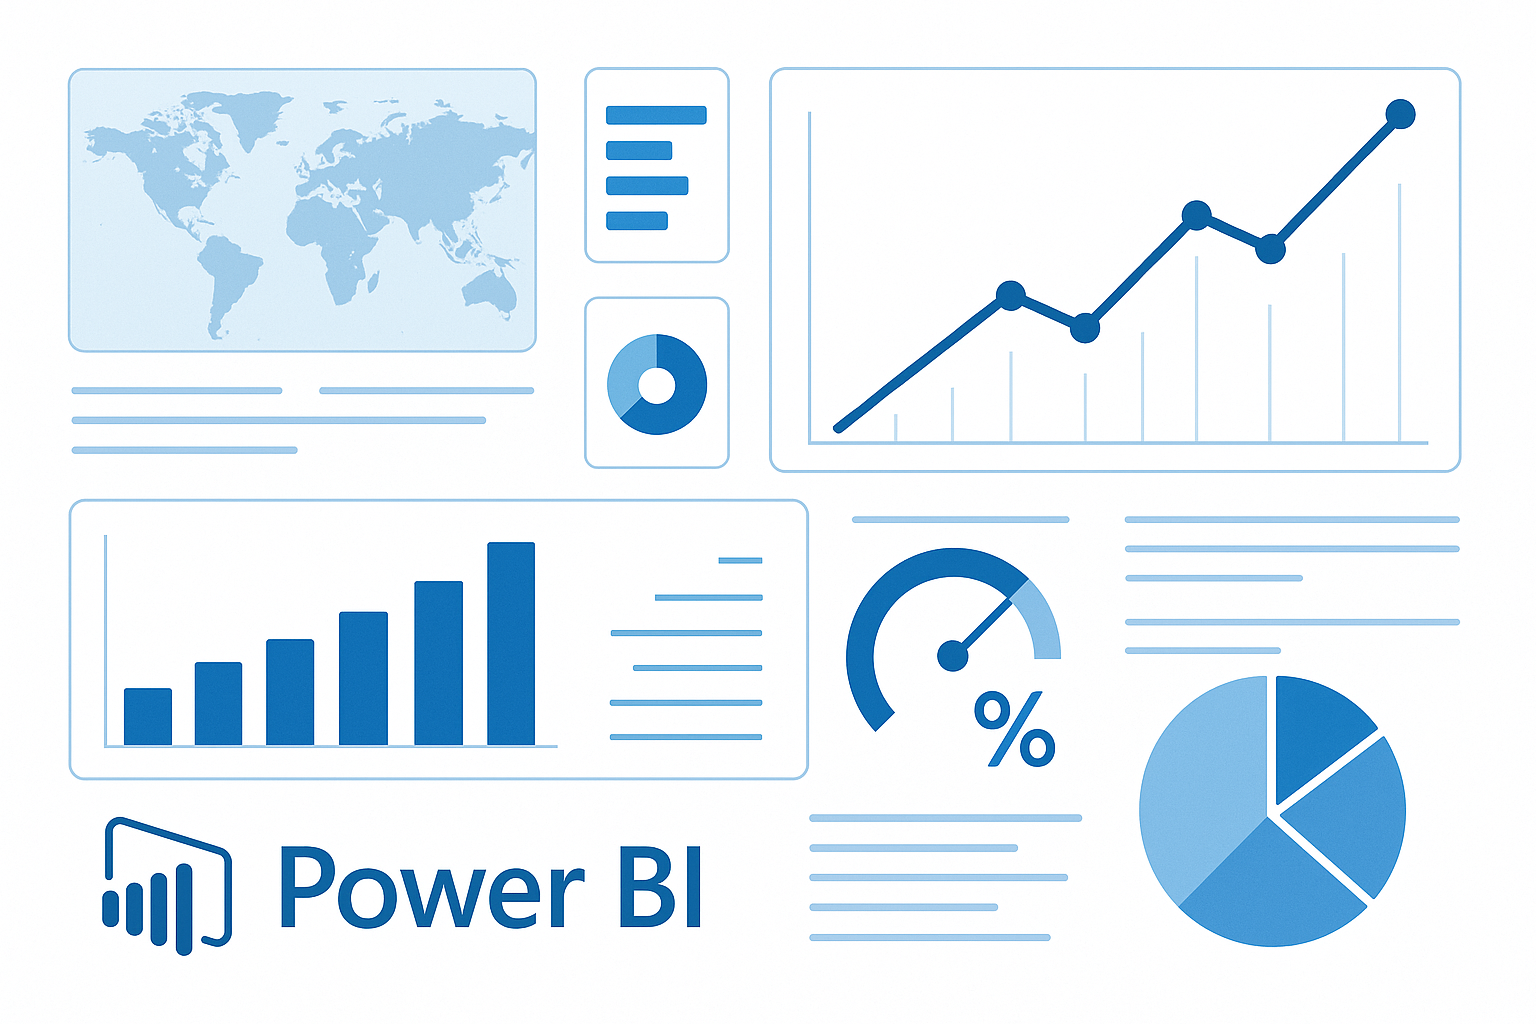
Now comes the fun part: building your report. Google Data Studio offers a variety of chart types and customization options, allowing you to create a dashboard that perfectly suits your needs.
Step 7: Customize Your Report
After building your report, you can customize it further by adding filters, calculated fields, and interactive elements. These features allow you to drill down into your data and uncover deeper insights.
Step 8: Share Your Report
Finally, once you’re satisfied with your dashboard, you can share it with others. Google Data Studio makes it easy to share your reports, either by sending a direct link or by embedding the report on a webpage.
In conclusion, Google Data Studio is a powerful tool for connecting and visualizing your data sources. With its user-friendly interface and powerful features, it allows you to create interactive dashboards that tell compelling stories. Happy data visualizing!
1 Comment
manisha
May 11, 2024Thanks for sharing this helpful post!